6,691
Total number of hijackings tallied in Mexico in 2024.
Reliance Partner’s Mexico Cargo Hijacking Data Portal is a tool to help nearshoring executives, journalists, international logistics professionals and researchers analyze roadway logistics risk in Mexico. We compile, consolidate, and crunch data from Mexico’s federal government’s National Public Security System in order to provide the first and only open source data portal on cargo hijackings in Mexico.
Total number of hijackings tallied in Mexico in 2024.
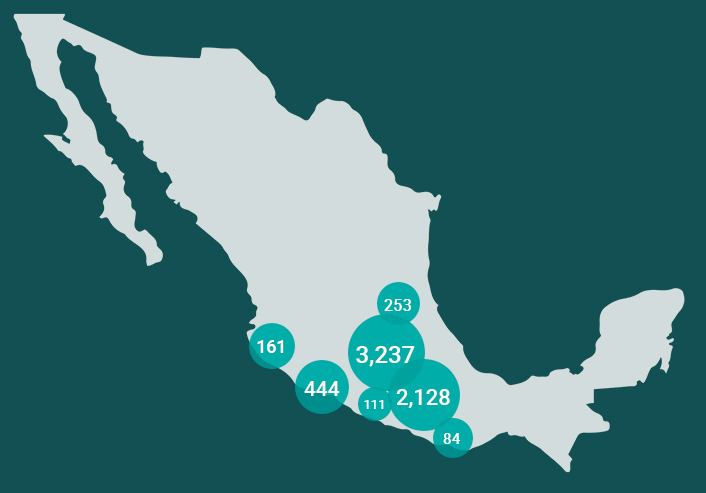
Percentage of hijackings that occurred in Mexico State and Puebla in 2024.
Percentage of hijackings that occurred in Mexico’s northern border states in 2024.
The map to the right shows Mexico’s Cargo Truck Hijacking Hotspots in 2024.
| Jan | Feb | Mar | Apr | May | Jun | Jul | Aug | Sep | Oct | Nov | Dec | |
| Aguascalientes | 0 | 0 | 0 | 0 | 0 | 0 | 0 | 0 | 0 | 0 | 0 | 0 |
| Baja California | 1 | 1 | 1 | 2 | 0 | 2 | 0 | 1 | 1 | 1 | 0 | 0 |
| Baja California Sur | 1 | 0 | 0 | 0 | 0 | 0 | 0 | 0 | 0 | 0 | 0 | 0 |
| Campeche | 0 | 0 | 0 | 0 | 0 | 0 | 0 | 0 | 0 | 0 | 0 | 0 |
| Chiapas | 1 | 0 | 0 | 0 | 0 | 0 | 0 | 0 | 0 | 0 | 0 | 0 |
| Chihuahua | 0 | 0 | 0 | 2 | 1 | 0 | 1 | 1 | 1 | 0 | 1 | 2 |
| Ciudad de México | 0 | 0 | 0 | 2 | 1 | 0 | 16 | 5 | 4 | 17 | 6 | 16 |
| Coahuila | 0 | 0 | 0 | 0 | 0 | 0 | 2 | 0 | 5 | 1 | 1 | 4 |
| Colima | 0 | 0 | 0 | 0 | 0 | 0 | 0 | 0 | 0 | 0 | 0 | 0 |
| Durango | 0 | 0 | 0 | 0 | 0 | 0 | 0 | 0 | 0 | 1 | 0 | 0 |
| Guanajuato | 1 | 0 | 0 | 0 | 0 | 0 | 0 | 0 | 0 | 0 | 0 | 0 |
| Guerrero | 0 | 0 | 0 | 0 | 0 | 0 | 0 | 1 | 1 | 1 | 0 | 0 |
| Hidalgo | 3 | 0 | 0 | 0 | 1 | 0 | 0 | 0 | 0 | 0 | 0 | 0 |
| Jalisco | 15 | 15 | 18 | 17 | 19 | 13 | 0 | 0 | 0 | 2 | 0 | 2 |
| México State | 295 | 253 | 258 | 307 | 266 | 227 | 252 | 273 | 241 | 337 | 276 | 252 |
| Michoacán | 32 | 29 | 33 | 40 | 48 | 27 | 29 | 31 | 29 | 48 | 46 | 52 |
| Morelos | 16 | 15 | 11 | 17 | 13 | 5 | 9 | 5 | 5 | 3 | 6 | 6 |
| Nayarit | 0 | 0 | 0 | 0 | 0 | 0 | 0 | 0 | 0 | 0 | 0 | 0 |
| Nuevo León | 1 | 1 | 1 | 1 | 3 | 5 | 4 | 3 | 6 | 3 | 7 | 4 |
| Oaxaca | 5 | 4 | 6 | 10 | 8 | 5 | 6 | 4 | 7 | 17 | 6 | 6 |
| Puebla | 217 | 179 | 182 | 188 | 191 | 164 | 185 | 183 | 191 | 177 | 136 | 135 |
| Querétaro | 0 | 0 | 0 | 0 | 0 | 0 | 0 | 0 | 0 | 0 | 0 | 0 |
| Quintana Roo | 0 | 1 | I 0 | 1 | 1 | 1 | 2 | 1 | 1 | 0 | 1 | 0 |
| San Luis Potosí | 12 | 27 | 12 | 21 | 15 | 31 | 30 | 21 | 24 | 24 | 18 | 18 |
| Sinaloa | 0 | 0 | 0 | 0 | 0 | 0 | 0 | 0 | 0 | 1 | 0 | 0 |
| Sonora | 1 | 0 | 0 | 1 | 0 | 1 | 0 | 0 | 0 | 0 | 0 | 0 |
| Tabasco | 0 | 0 | 0 | 0 | 0 | 0 | 0 | 0 | 0 | 0 | 0 | 0 |
| Tamaulipas | 0 | 0 | 0 | 0 | 0 | 0 | 0 | 0 | 1 | 0 | 0 | 1 |
| Tlaxcala | 13 | 7 | 7 | 6 | 5 | 13 | 12 | 5 | 9 | 5 | 8 | 10 |
| Veracruz | 4 | 4 | 5 | 4 | 3 | 2 | 7 | 1 | 6 | 7 | 4 | 6 |
| Yucatán | 0 | 0 | 0 | 0 | 0 | 0 | 0 | 0 | 0 | 0 | 0 | 0 |
| Zacatecas | 1 | 1 | 0 | 0 | 1 | 0 | 0 | 1 | 0 | 0 | 0 | 0 |
| Jan | Feb | Mar | Apr | May | Jun | Jul | Aug | Sep | Oct | Nov | Dec | |
| Aguascalientes | 0 | 0 | 0 | 0 | 0 | 0 | 0 | 0 | 0 | 0 | 0 | 0 |
| Baja California | 2 | 0 | 0 | 0 | 1 | 0 | 1 | 0 | 0 | 2 | 3 | 0 |
| Baja California Sur | 0 | 0 | 0 | 0 | 0 | 0 | 0 | 0 | 0 | 0 | 0 | 0 |
| Campeche | 0 | 0 | 0 | 0 | 1 | 0 | 1 | 0 | 0 | 0 | 0 | 0 |
| Chiapas | 1 | 1 | 0 | 0 | 0 | 0 | 0 | 1 | 0 | 0 | 0 | 0 |
| Chihuahua | 0 | 0 | 1 | 1 | 2 | 0 | 1 | 1 | 2 | 0 | 1 | 1 |
| Ciudad de México | 5 | 5 | 10 | 5 | 4 | 4 | 1 | 13 | 8 | 5 | 2 | 4 |
| Coahuila | 0 | 0 | 0 | 0 | 0 | 0 | 1 | 0 | 1 | 1 | 0 | 0 |
| Colima | 0 | 0 | 0 | 0 | 0 | 0 | 1 | 0 | 0 | 0 | 0 | 0 |
| Durango | 0 | 0 | 0 | 0 | 0 | 0 | 0 | 0 | 0 | 0 | 0 | 0 |
| Guanajuato | 1 | 0 | 0 | 0 | 2 | 2 | 1 | 0 | 2 | 3 | 1 | 0 |
| Guerrero | 0 | 0 | 0 | 0 | 0 | 0 | 0 | 0 | 0 | 0 | 0 | 0 |
| Hidalgo | 4 | 2 | 1 | 0 | 4 | 1 | 0 | 0 | 4 | 0 | 2 | 1 |
| Jalisco | 36 | 27 | 28 | 20 | 18 | 21 | 18 | 20 | 7 | 8 | 24 | 16 |
| México State | 341 | 275 | 335 | 268 | 305 | 304 | 273 | 313 | 316 | 309 | 292 | 303 |
| Michoacán | 56 | 45 | 66 | 57 | 49 | 61 | 57 | 35 | 37 | 42 | 19 | 40 |
| Morelos | 17 | 9 | 8 | 13 | 17 | 9 | 6 | 9 | 8 | 12 | 5 | 8 |
| Nayarit | 0 | 0 | 0 | 0 | 0 | 0 | 0 | 0 | 0 | 0 | 0 | 0 |
| Nuevo León | 8 | 3 | 6 | 3 | 4 | 5 | 5 | 6 | 2 | 3 | 4 | 0 |
| Oaxaca | 15 | 13 | 28 | 11 | 12 | 23 | 10 | 8 | 12 | 11 | 8 | 12 |
| Puebla | 177 | 170 | 240 | 217 | 278 | 251 | 214 | 199 | 217 | 162 | 213 | 195 |
| Querétaro | 0 | 0 | 0 | 0 | 0 | 0 | 0 | 0 | 0 | 0 | 0 | 0 |
| Quintana Roo | 1 | 0 | 2 | 4 | 1 | 2 | 0 | 0 | 2 | 2 | 1 | 1 |
| San Luis Potosí | 29 | 24 | 18 | 24 | 17 | 12 | 3 | 20 | 14 | 13 | 17 | 28 |
| Sinaloa | 0 | 1 | 0 | 0 | 0 | 0 | 0 | 1 | 0 | 0 | 0 | 0 |
| Sonora | 1 | 1 | 0 | 0 | 1 | 1 | 0 | 0 | 0 | 2 | 1 | 0 |
| Tabasco | 1 | 0 | 1 | 0 | 0 | 0 | 0 | 0 | 0 | 0 | 0 | 0 |
| Tamaulipas | 0 | 0 | 0 | 0 | 0 | 0 | 0 | 0 | 0 | 8 | 6 | 12 |
| Tlaxcala | 8 | 6 | 5 | 6 | 3 | 2 | 5 | 13 | 11 | 8 | 6 | 12 |
| Veracruz | 7 | 6 | 7 | 4 | 11 | 10 | 6 | 10 | 4 | 10 | 7 | 11 |
| Yucatán | 0 | 0 | 0 | 0 | 0 | 0 | 0 | 0 | 0 | 0 | 0 | 0 |
| Zacatecas | 0 | 0 | 0 | 0 | 1 | 0 | 0 | 0 | 0 | 0 | 1 | 0 |